
In this lesson, we will read an article from Boundless.com about about the importance of standard deviation and variance in investing.
Vocabulary
Standard deviation and variance are difficult concepts. Here are two definitions from Boundless.com that connect standard deviation and variance specifically to investment.
- Standard deviation: The standard deviation of an investment is obtained by taking the square root of the variance. It has a more straightforward meaning than variance. It tells you that in a given year, you can expect an investment's return to be one standard deviation above or below the average rate of return.
- Variance: In finance, variance is a term used to measure the degree of risk in an investment. It is calculated by finding the average of the squared deviations from the mean rate of return.
Pre-reading
Read the first two paragraphs of the article below. In partners or groups, discuss the questions that follow.
Boundless. "Variance." Boundless Finance Boundless, 8 Aug. 2016. Retrieved 30 Jun. 2017 from https://www.boundless.com/finance/textbooks/boundless-finance-textbook/introduction-to-risk-and-return-8/understanding-return-76/variance-341-6600/
Introducing Variance
In probability theory and statistics, the variance is a measure of how far a set of numbers is spread out. It is one of several descriptors of a probabilitydistribution, describing how far the numbers lie from the mean (expected value).
Understanding the concept of variance along with three typical asset classes -- money market, bonds, stocks -- can help you build a portfolio for any investor. Money market investments are very safe, they almost never go in the red, but they also don't pay high returns. Stocks are on the opposite end of the spectrum, going back and forth between red and black from year to year frequently, but over longer periods of time they usually pay higher premiums. Bonds are somewhere in the middle. They are safer than a stock, but riskier than a money market and their average returns reflect that.
Discussion questions:
- Are there any words you don't know? In particular, do you know what money market investments, bonds and stocks are?
- Which investments pay the best returns?
- Which investments are the safest?
Reading
Read the rest of the article. Go to the Exercise Link and complete the Exercise.
Introducing variance (continued)
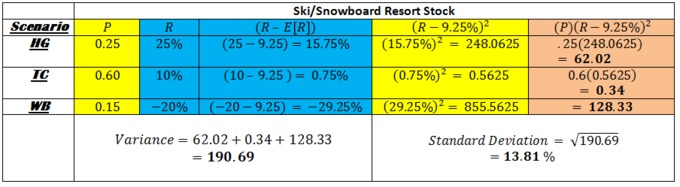
This table shows how to calculate the variance of an investment outcome .
More info here.
How much do investors want to pay to have to take the good with the bad? Calculating variance is a 3 step process once expected return has been calculated. Calculate deviations from mean (blue), square the deviations (yellow), multiply the squared deviation by its original probability (orange). Get brownie points by taking the square root of that number and interpret its meaning in the form of a sentence.
You may not need to calculate variance yourself, but you should still notice how we got it. In the figure, we started with three scenarios and a probability (P) and return (R) associated with each. We did some math and ended up using the two blue columns to get the yellow one. Then we multiplied the two yellow columns to get the orange one. We get the variance from adding up the numbers in the orange column. Of the three numbers, we add (62, 0.34, and 128). Two are very big and one is very small. The small number comes from the TC scenario where the stock returns 10%, which is very close to our expectation of 9.25%. The bigger numbers come from winters that are extreme -- when the stock performs way above 9.25% (HG) or way below it (WB). The standard deviation can be read as a percentage. It means that, even though we can expect an average of 9.25% return on our stock over the course of 50 years, if we take any given year out and look at its performance, it is likely be somewhere within 13.81% above or below that figure.
Variance in Relation to Expected Return
In the discussion of expected return, we concluded that, based on your research, you can expect the Ski/Snowboard Resort in Colorado to have an expected return of 9.25% based on three distinct weather outcomes. However, if you invest your $20,000 in that company and expect to have $21,850 after a year, you must remember that this isn't a dice game that you can play over and over again. There will only be one result in this case and at the end of it, you have to make a down payment on a house. Is this a good investment idea?
What if your bid for a house won't be accepted unless you can put at least $20,000 down? There is an 85% chance that the winter is either hella gnarly (HG) or totally chillax (TC), and in either of those cases you will still have over $20,000 to make a down payment. There is also a 15% chance that the year ends up being wicked bogus (WB), and if that is the case you will lose 20% or $4,000 of your initial investment. Now you have $16,000 and all of a sudden you are thinking tree fort. Let's compare that investment to a CD at a bank that pays 3.25% no matter how much snow falls this winter. You can have an investment that is federally insured to pay you $20,650 one year from today and you can be assured to have enough to make a down payment on your house.
If you can let that $20,000 investment sit for 10 years before you need it, there is a much better chance that you will end up in the black (experiencing a profit) than in the red (experiencing a loss). A 30 year old with a 401K can be much more aggressive in his portfolio than a 65 year old who will be retiring in one year can. Every portfolio should be modeled with time-frame and risk tolerance considerations. It would be just as foolish for the 65 year old to be investing in aggressive stocks as it would for the 30 year old to buy conservative CD's in his retirement account.