In academic and professional settings, we often encounter data presented in visual formats like graphs and charts. Understanding how to interpret and describe these visuals is a crucial skill. This lesson will teach you the essential vocabulary and grammar to analyze climate data and communicate trends clearly and accurately.
Data Walkthrough: Climate Trends
Let's begin by examining three different graphs related to climate change. Look at each one carefully and try to identify the main story it tells. What is being measured? What is the time frame? What is the overall trend?
Graph 1: Annual CO₂ Emissions
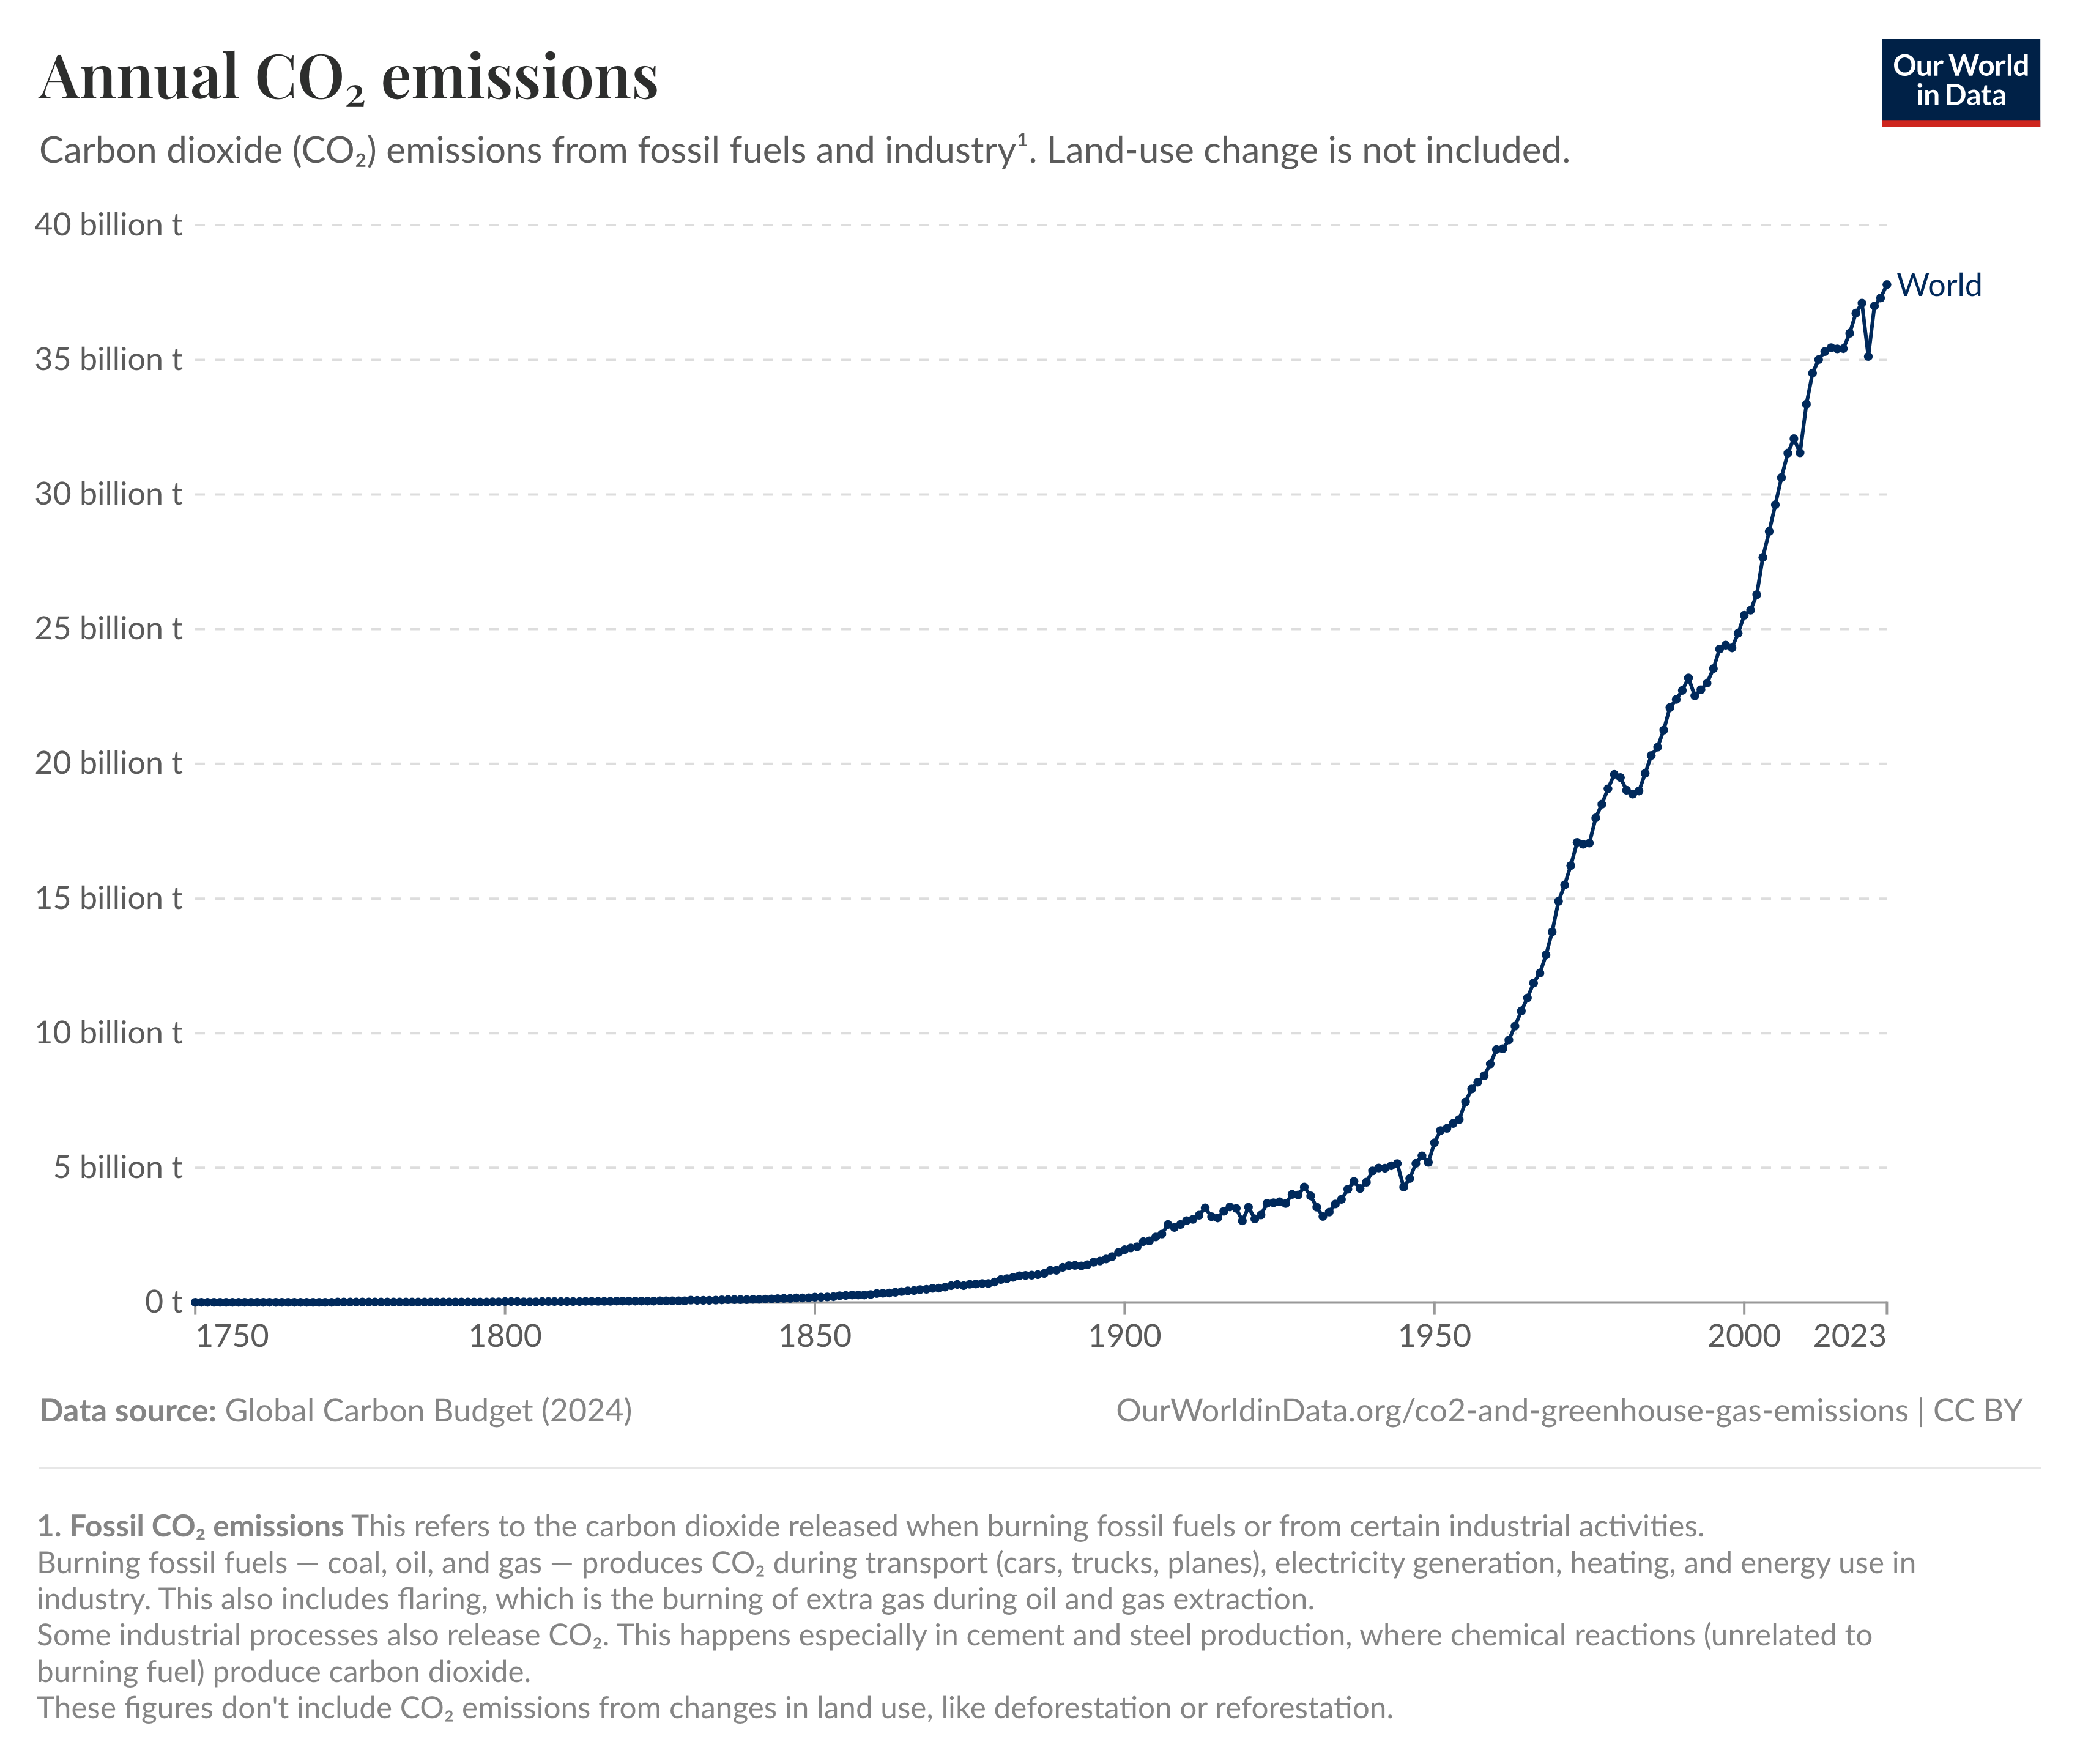
Total annual CO₂ emissions from fossil fuels and industry. Source: Our World in Data.
Graph 2: Average Global Sea Level Change
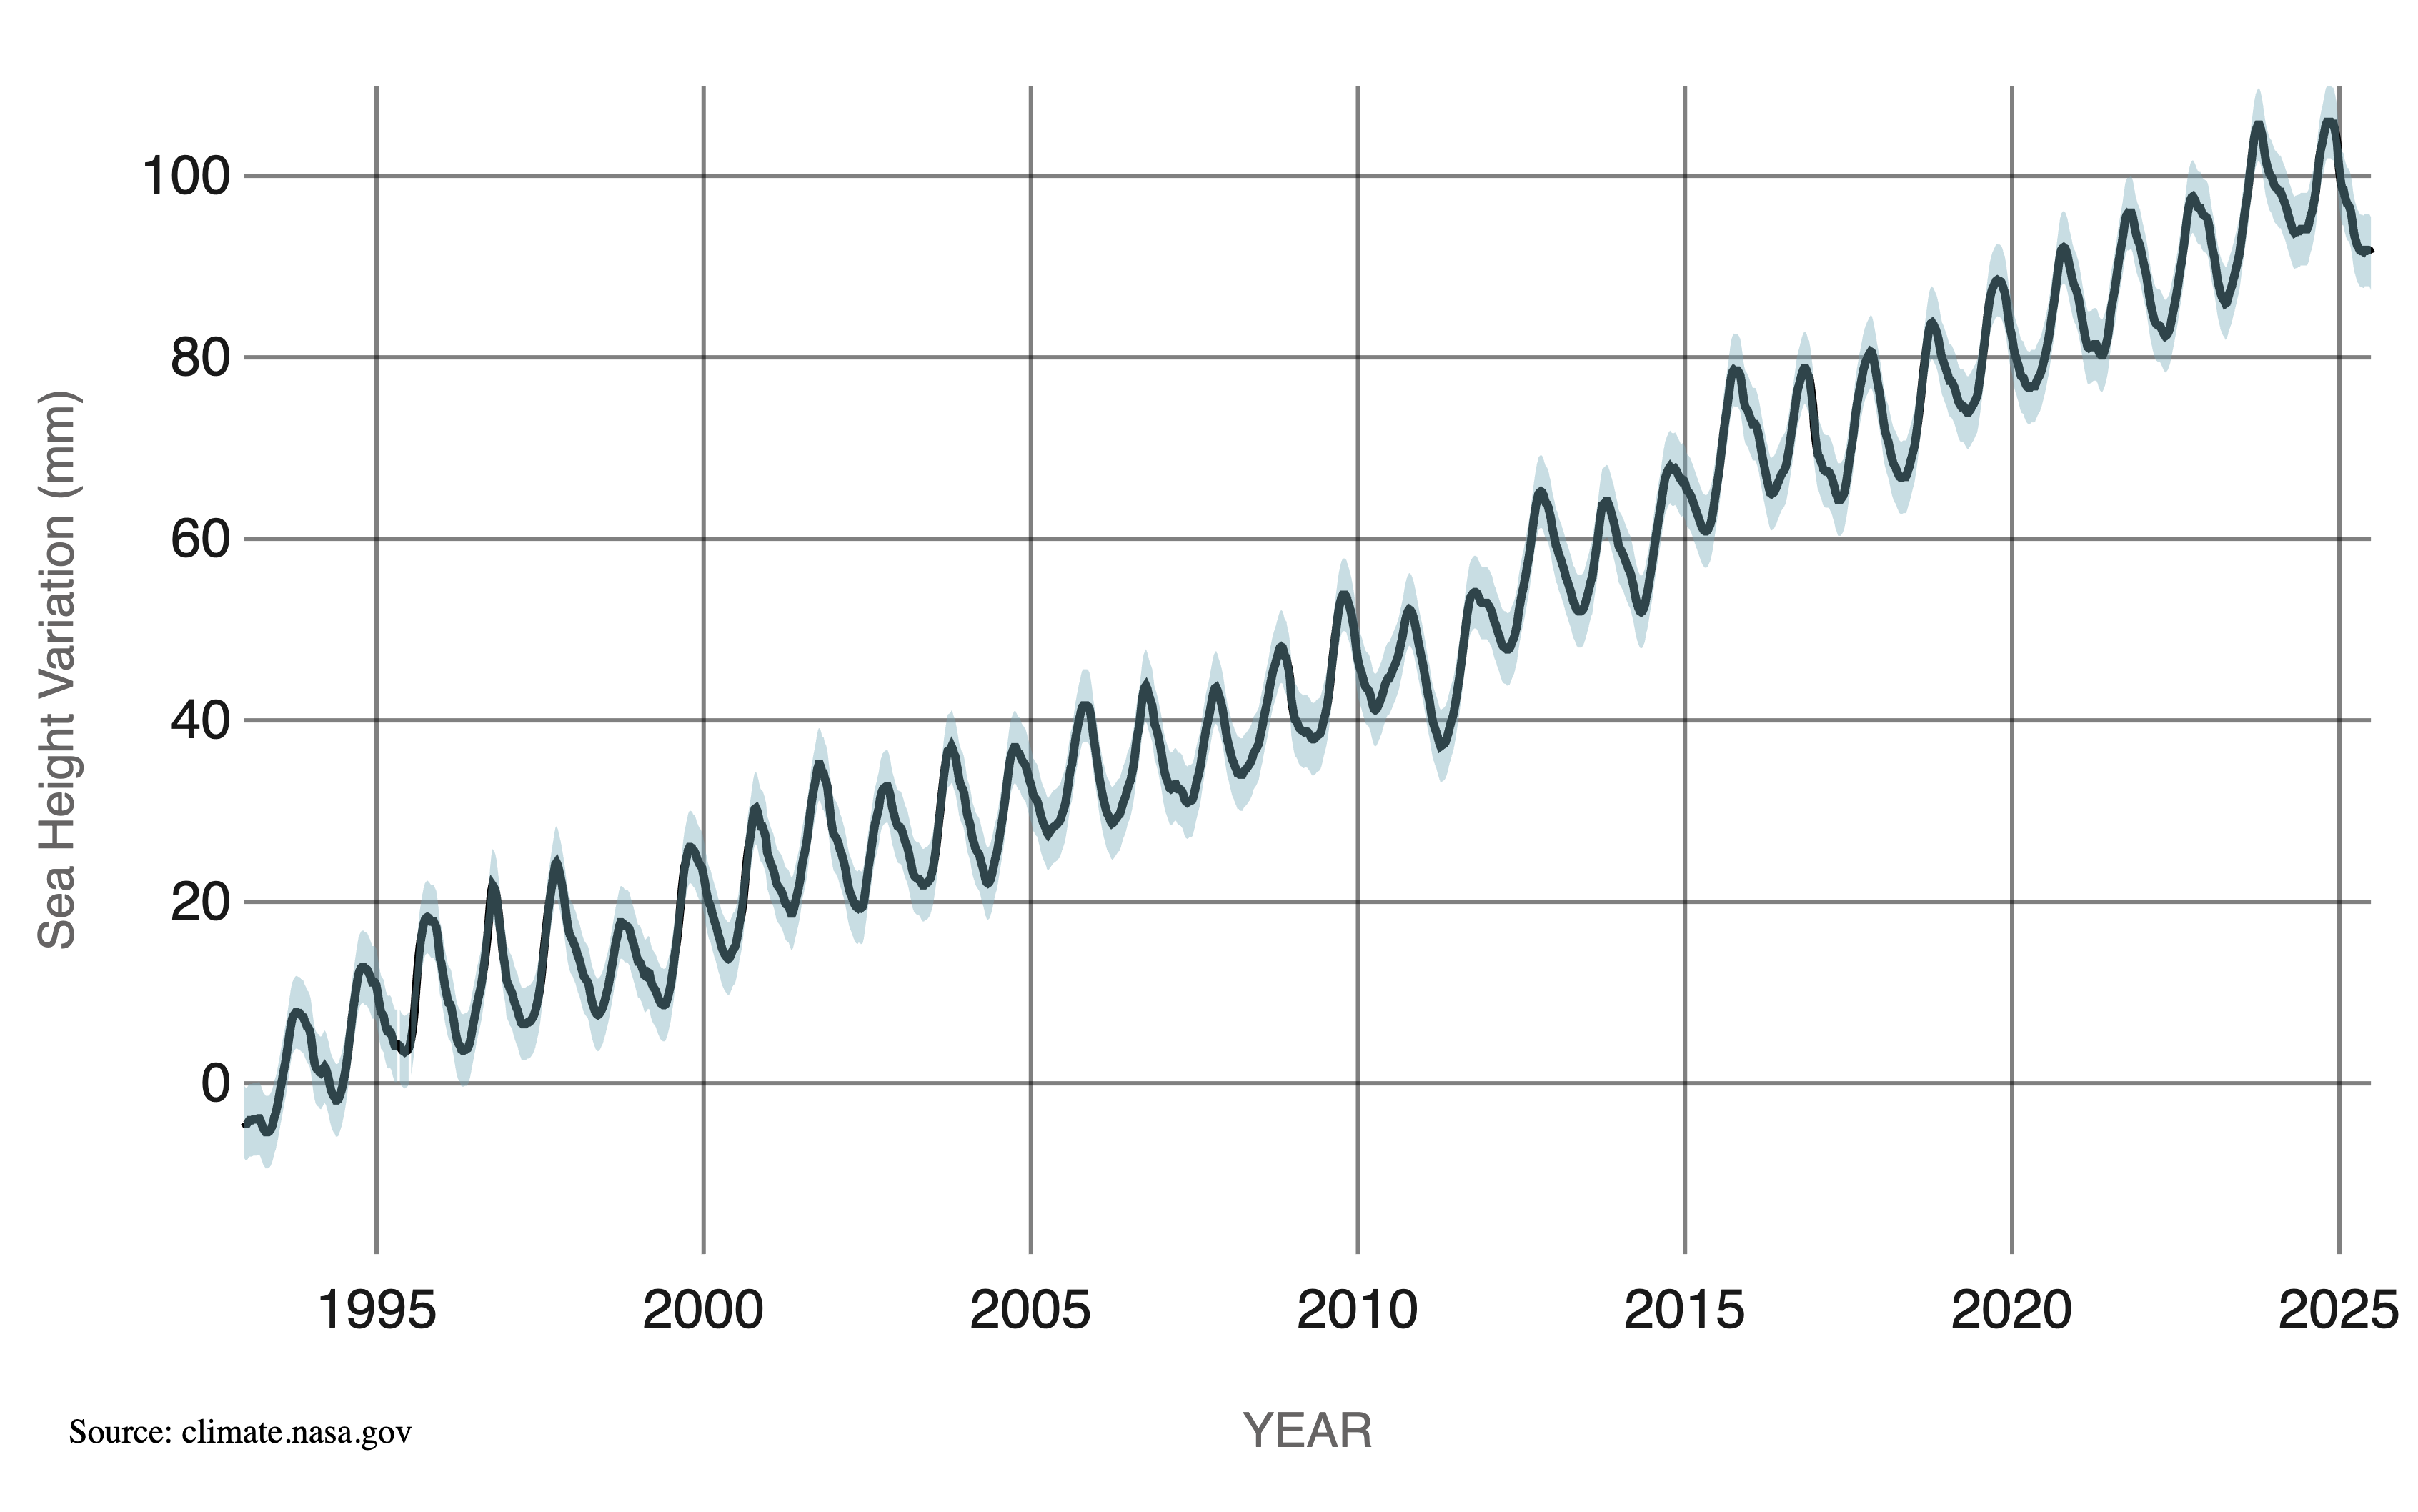
Change in global average sea level, measured in millimeters. Source: NASA Climate.
Graph 3: Renewable Electricity in the EU
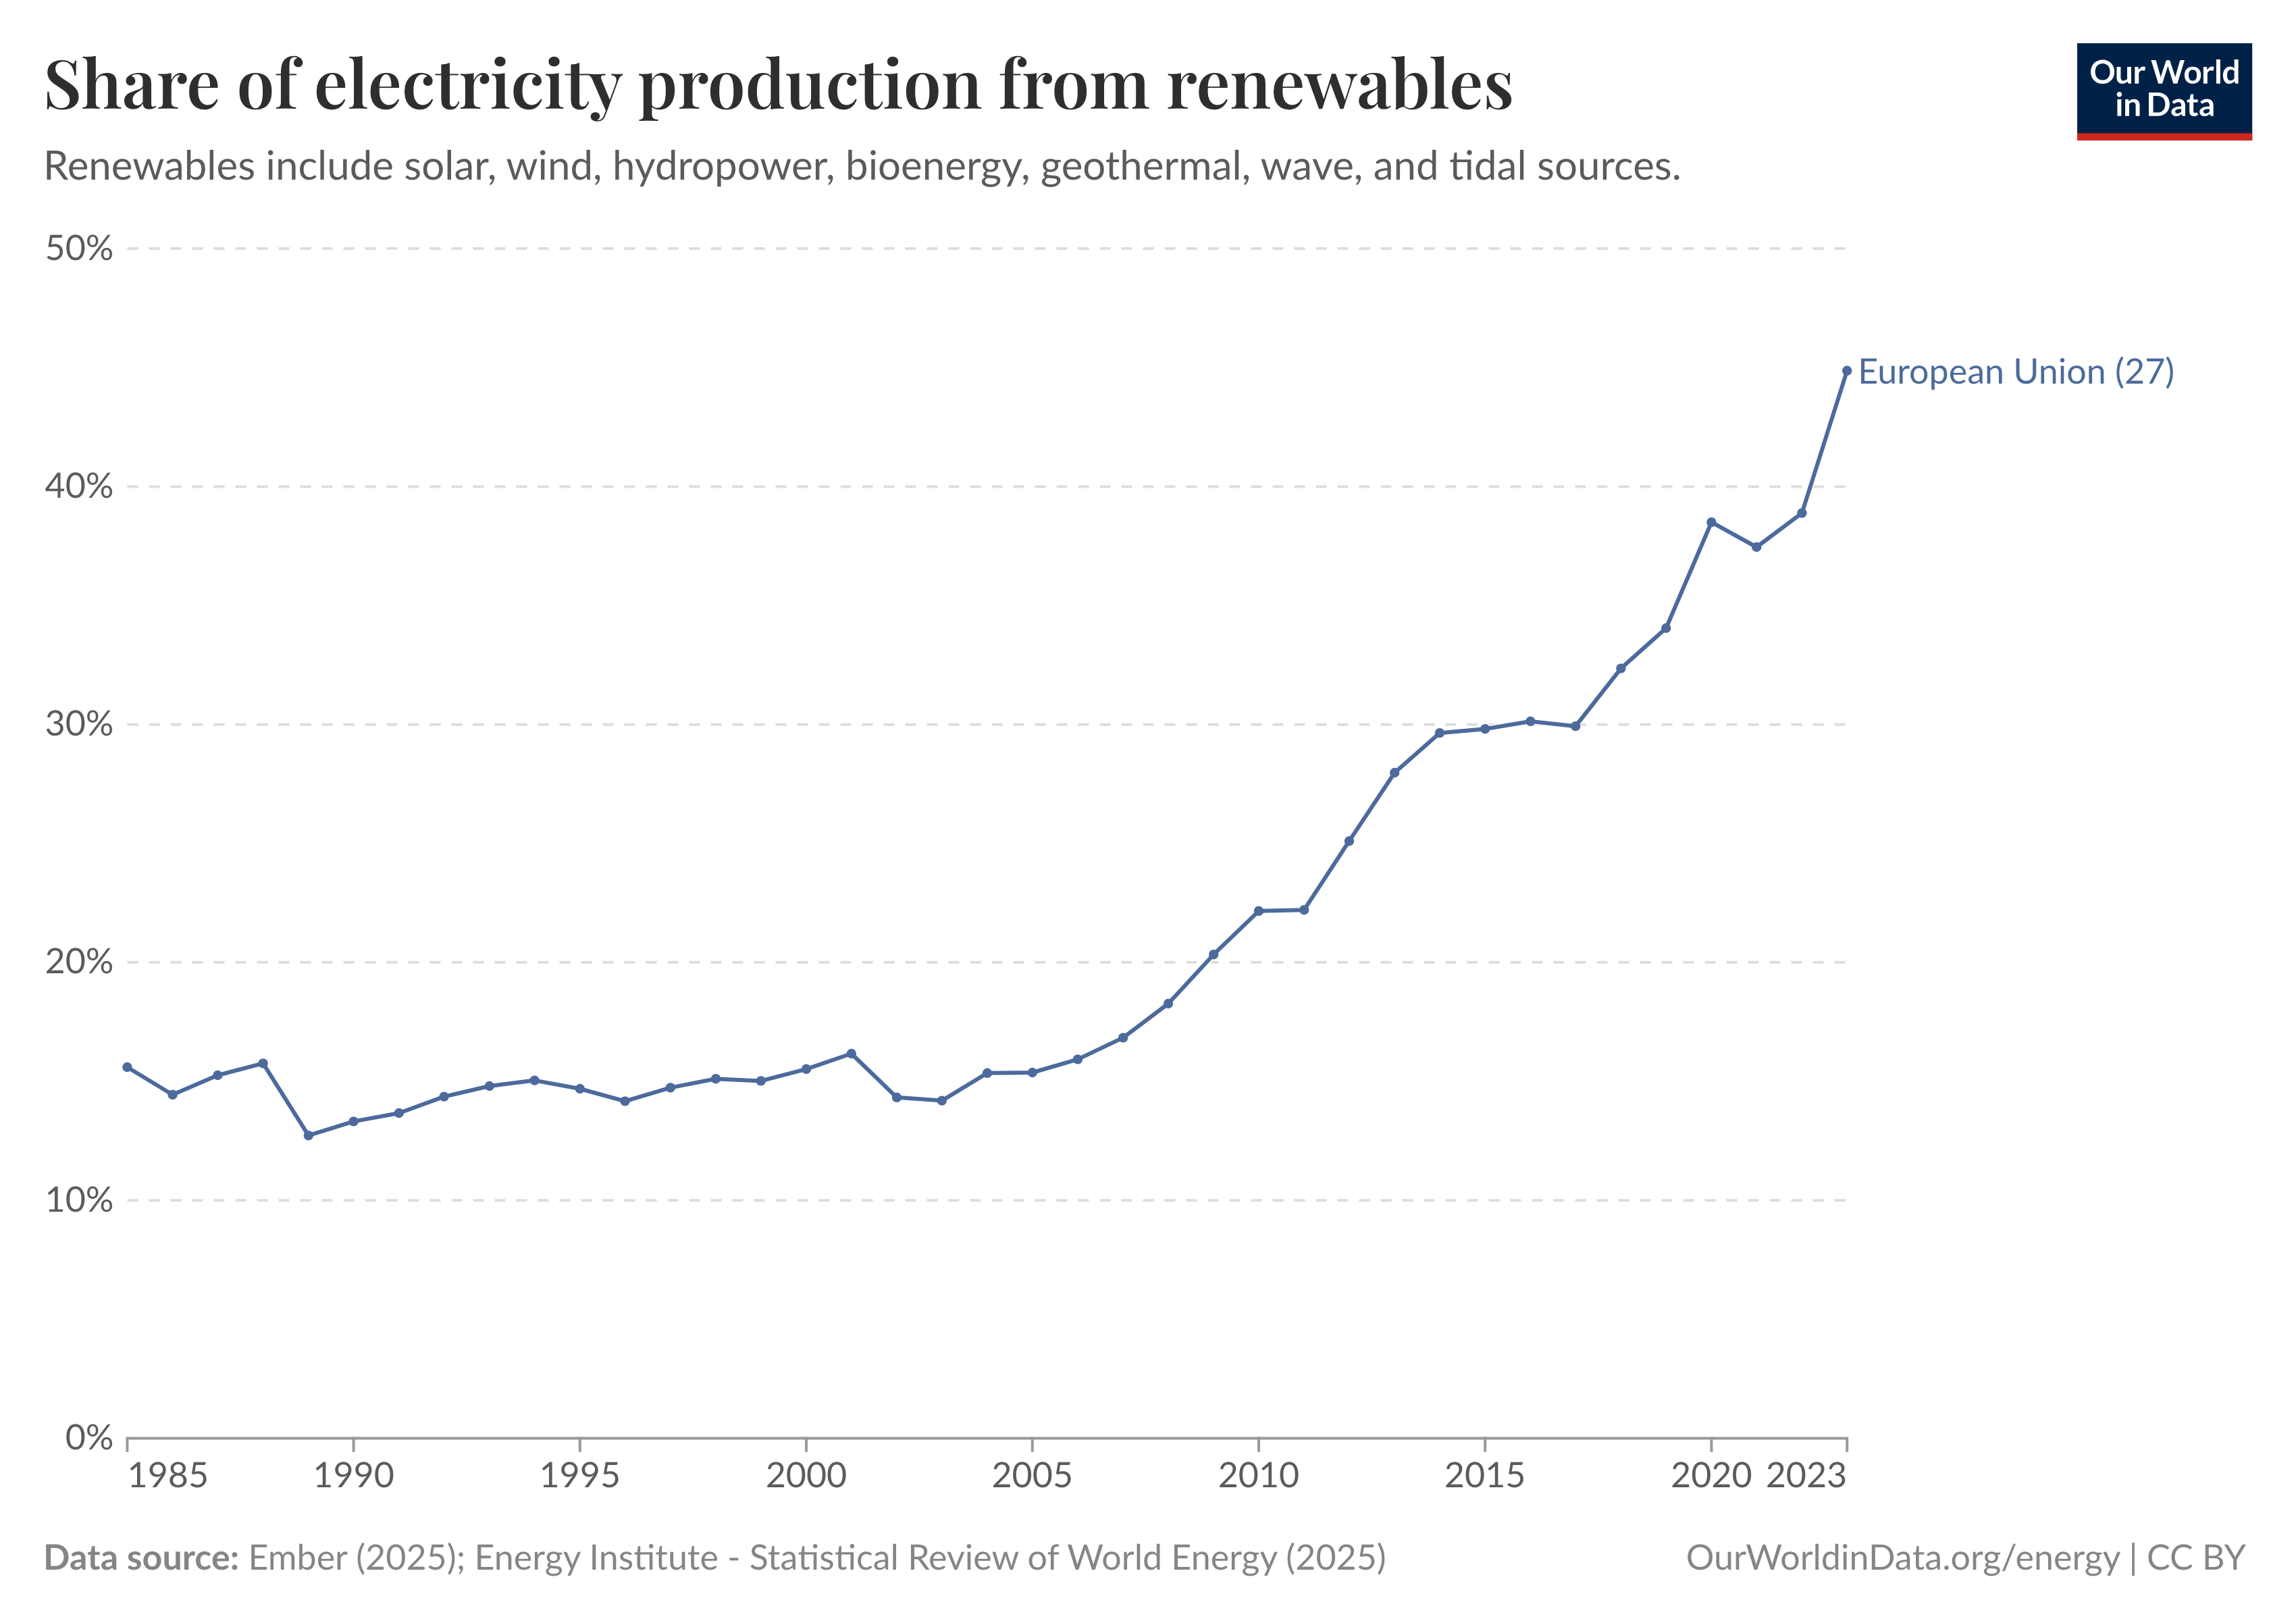
The share of electricity production from renewable sources in the EU. Source: Our World in Data.
Vocabulary: Describing Change
To describe the data in these graphs, we need specific vocabulary. These words help us explain what is happening over time.
| Word | Definition | Example |
|---|---|---|
| graph | a diagram showing the relation between variable quantities. | This graph shows how temperatures have changed over a century. |
| increase (v/n) | to become or make greater in size, amount, or degree. | Global temperatures are expected to increase. |
| decrease (v/n) | to become or make smaller or fewer in size, amount, or degree. | There was a slight decrease in the emission rate last year. |
| rise (v/n) | an upward movement; an increase. | We can see a steady rise in sea levels since 1993. |
| fall (v/n) | a downward movement; a decrease. | After the new policy, there was a sharp fall in industrial pollution. |
| peak (v/n) | to reach the highest point or level. | Emissions peaked in 2019 before showing a small decline. |
| plateau (v/n) | to reach a state of little or no change after a period of activity or progress. | The growth in consumption seemed to plateau for a few years. |
| stabilize (v) | to become stable; to stop changing. | The government hopes the emission rate will stabilize. |
| fluctuate (v) | to rise and fall irregularly in number or amount. | The price of solar panels tended to fluctuate in the early 2000s. |
| emission rate | the speed at which pollutants are released into the atmosphere. | The country's emission rate is one of the highest in the world. |
Grammar Focus
Unlock full access by logging in. Registered users can explore the entire lesson and more.