In today's global business environment, decisions are driven by data. But raw data is often complex and difficult to understand. That's why we use visual tools like charts and graphs to tell a story. In this lesson, you will learn the language of data storytelling. We will focus on how to describe trends, make comparisons, and summarize visual information accurately and professionally—a crucial skill for academic tests like the ITEP and for your future career.
7 Tips for Better Dashboard Design
This video explains key principles for making data clear and easy to understand.
Understanding the Visuals
In business and academic presentations, you will frequently encounter three main types of charts. Each type is best for showing a different kind of information. Let's look at some examples.
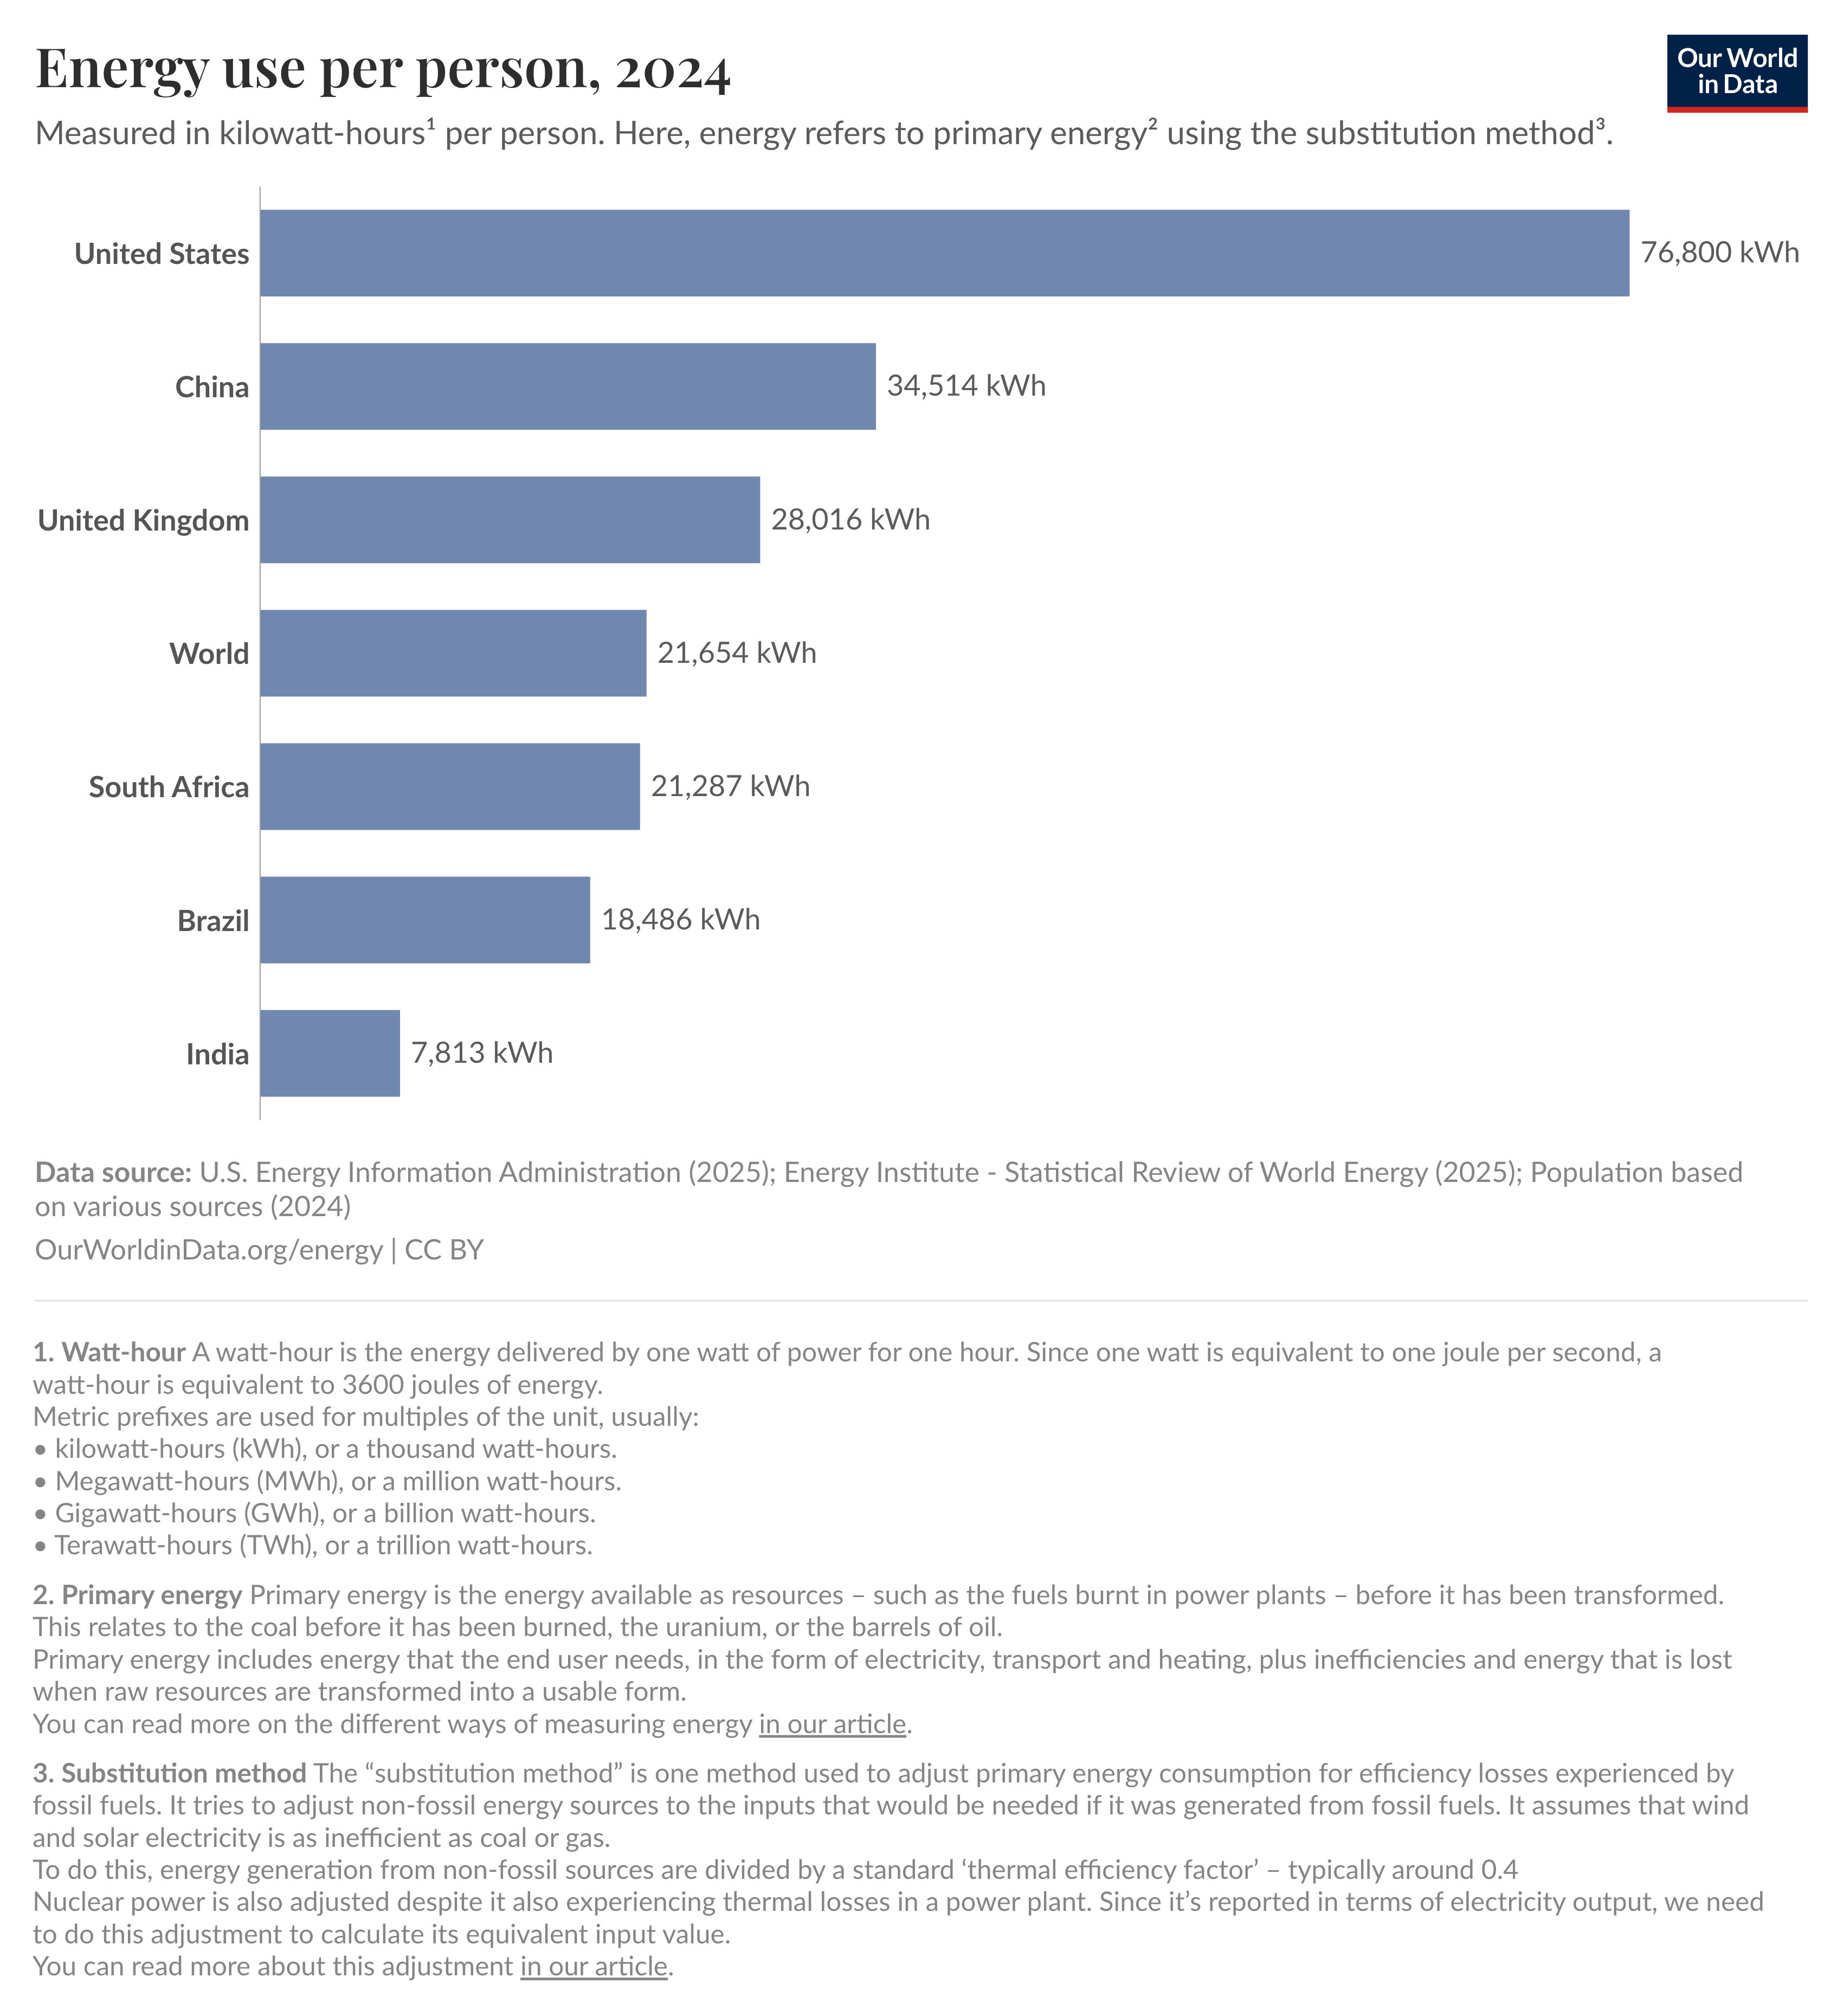
Bar Chart: Comparing Quantities
Energy use per person, 2024
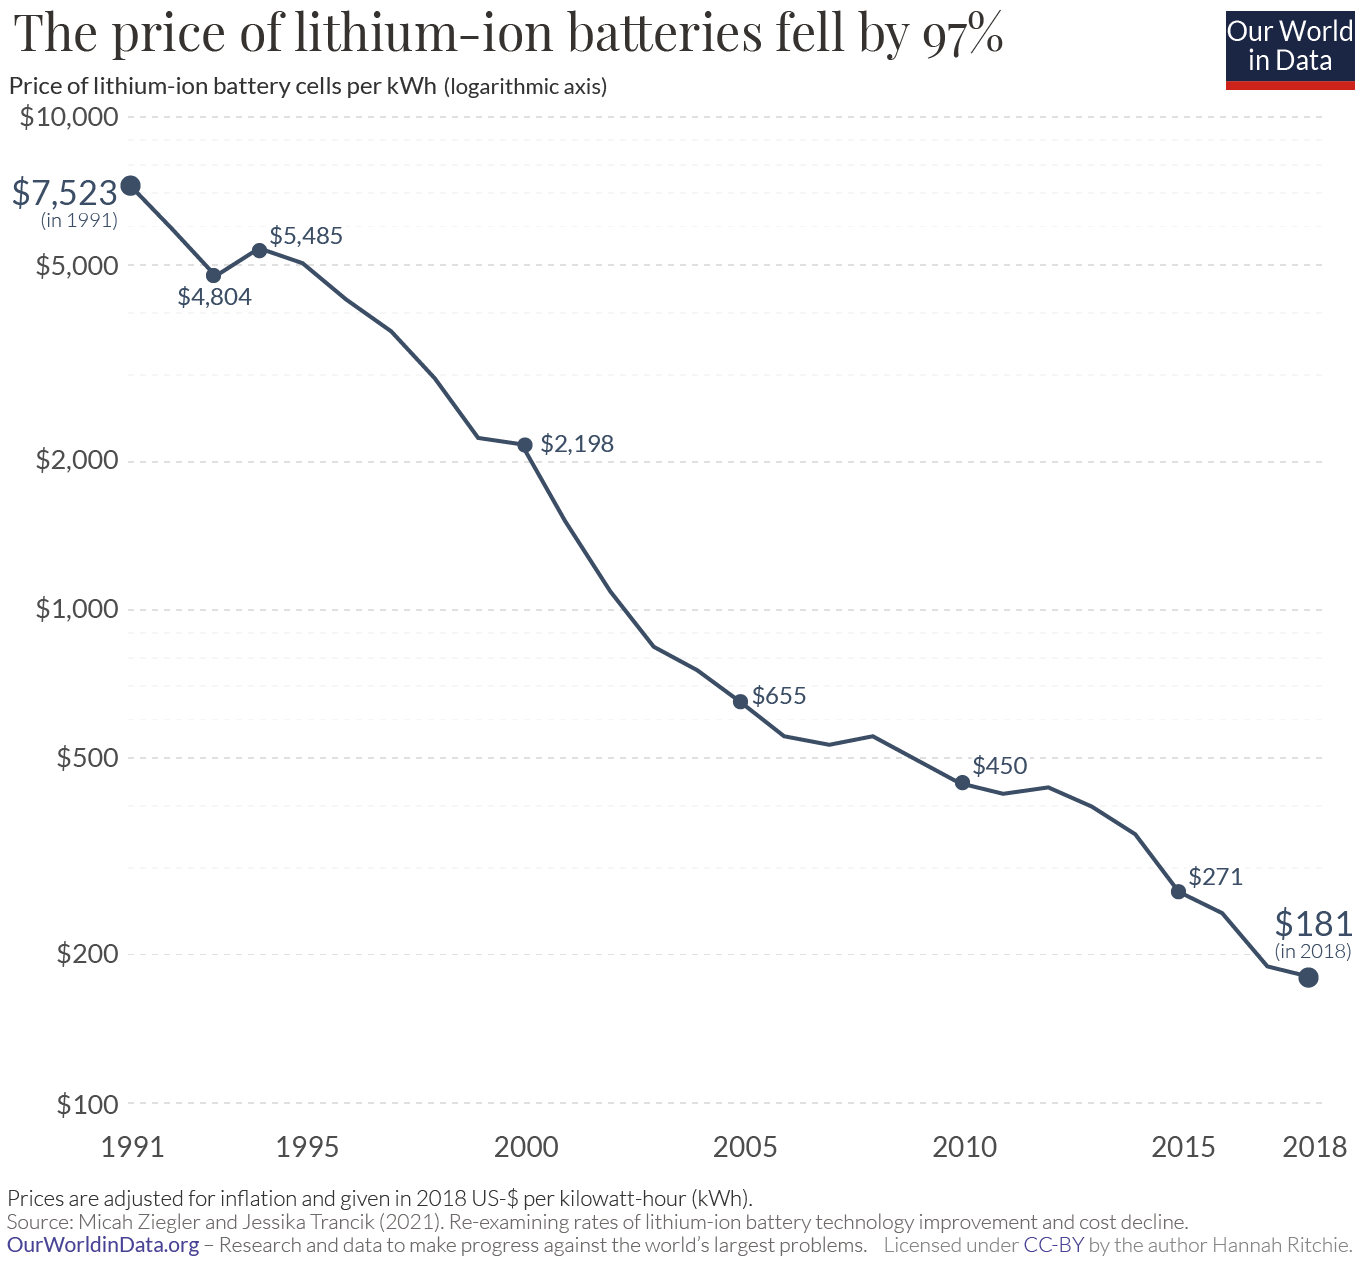
Line Graph: Showing Trends Over Time
The price of lithium-ion battery cells declined by 97% in the last three decades.
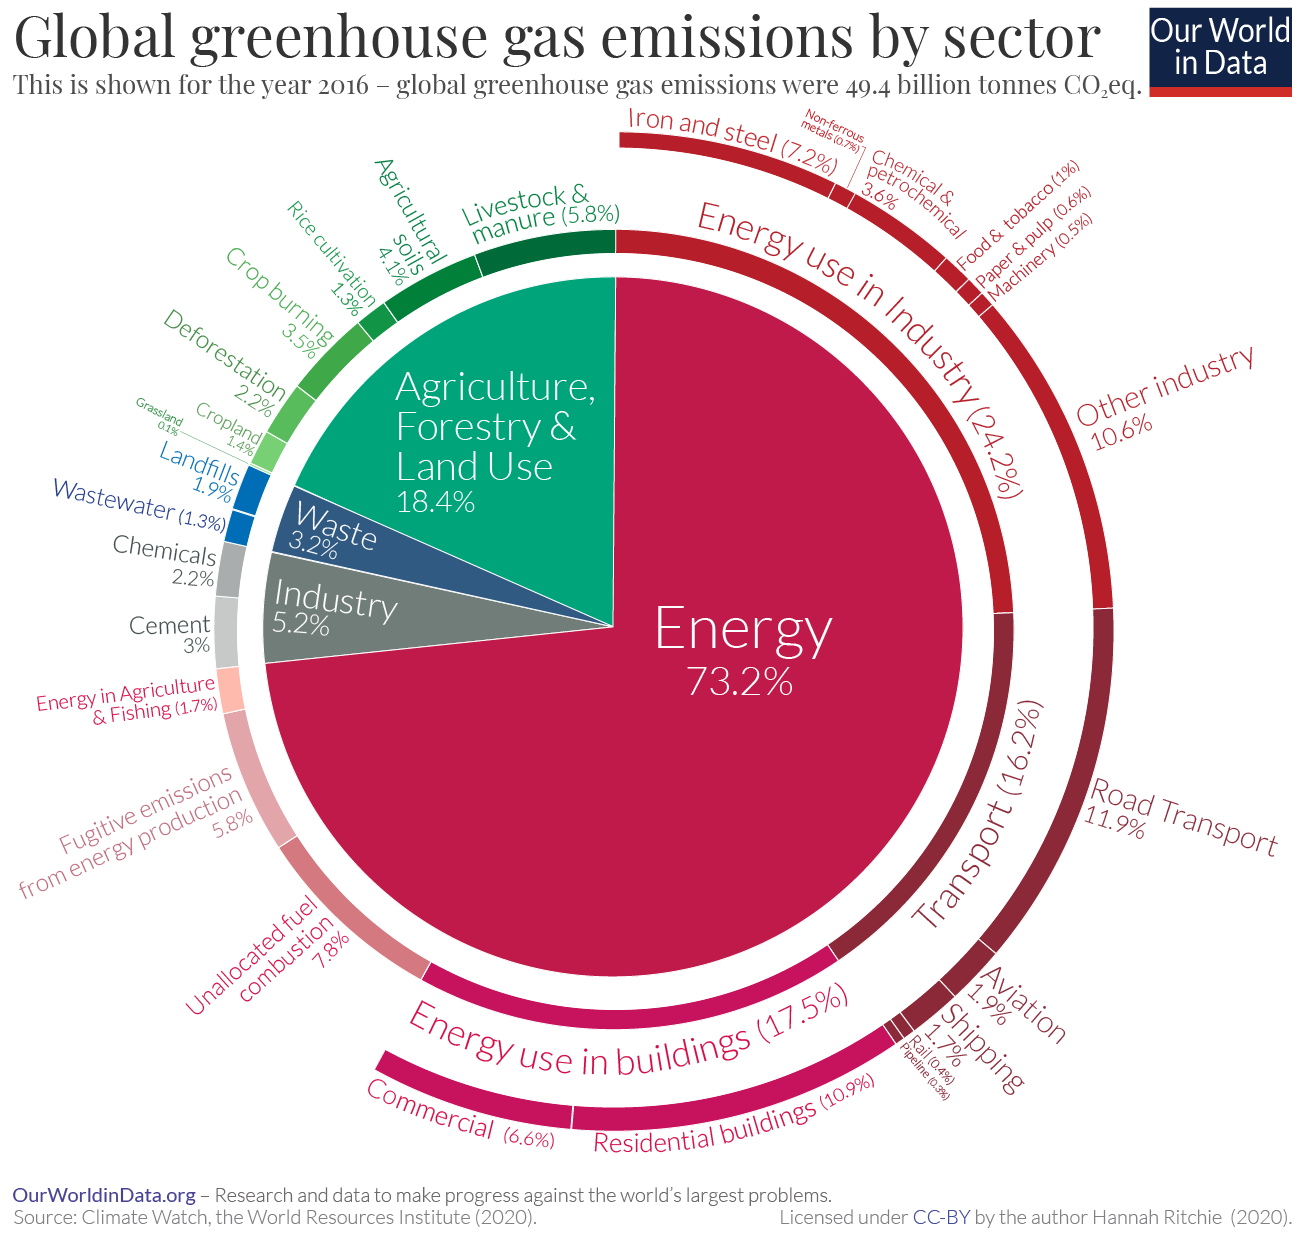
Pie Chart: Illustrating Proportions
A pie chart is a circle divided into slices to show the proportion or percentage of different parts that make up a whole. This chart displays the sources of global emissions.
Vocabulary for Data Description
To describe these charts effectively, you need specific vocabulary. Here are some key terms.
| Word | Definition | Example |
|---|---|---|
| chart | A visual representation of data, such as a graph or diagram. | The first chart clearly compares the sales of two different products. |
| sales | The amount of goods or services sold by a company in a specific period. | Giga-Gadget sales were highest in the fourth quarter. |
| peak | (verb) To reach the highest point or value. (noun) The highest point. | The company's revenue reached its peak in 2025. |
| decline | (verb) To decrease in quantity or quality. (noun) A gradual and continuous loss of strength, numbers, quality, or value. | There was a slight decline in revenue in 2023 before it started growing again. |
| trend | A general direction in which something is developing or changing. | The overall trend for Innovate Inc.'s revenue is positive growth. |
| volatility | The quality of being likely to change suddenly and unexpectedly. | The stock market is known for its volatility, with prices often fluctuating. |
| growth rate | The speed at which something increases over a specific period. | The company experienced a steady growth rate of over 15% per year. |
| steady | Happening in a smooth, regular, and continuous way. | Although there was a small dip, the company's growth has been relatively steady. |
| significant | Large or important enough to be noticeable or have an effect. | Innovate Inc. holds a significant share of the market for smart-widgets. |
Grammar for Analysis
Unlock full access by logging in. Registered users can explore the entire lesson and more.